Prosthetic Gait Analysis
Motivation
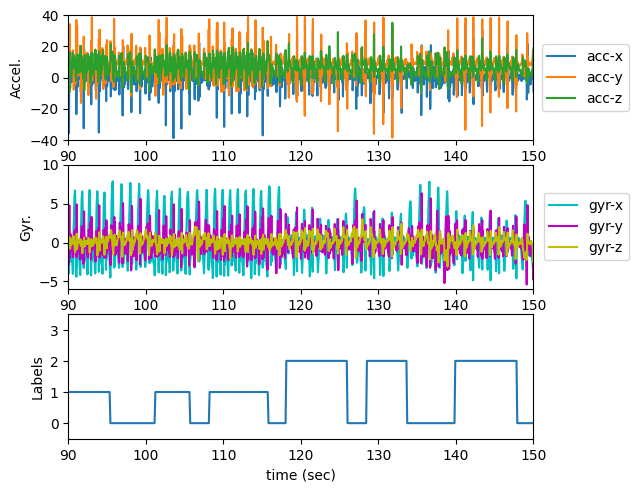
Lower-limb robotic prosthetics can execute different behaviors based on the terrain users are walking on. By using telemetry data from the prosthetic, we can analyze the gait of the user and determine the terrain type. In this project our goal will be recognition of human gait while walking on hard and soft terrains, and climbing up and down stairs.
Performance Analysis
When analyzing the performance of the various models, we focused on the F1-Score of model results using the test data set. The F1-score is a balanced metric that considers both precision and recall, making it a reliable measure for comparing model performance, especially in multi-class classification problems like this one. The Random Forest model achieved an F1-Score of 0.71, while the best MLP F1-Score reached 0.75 with 4 hidden layers, 64 neurons per layer.
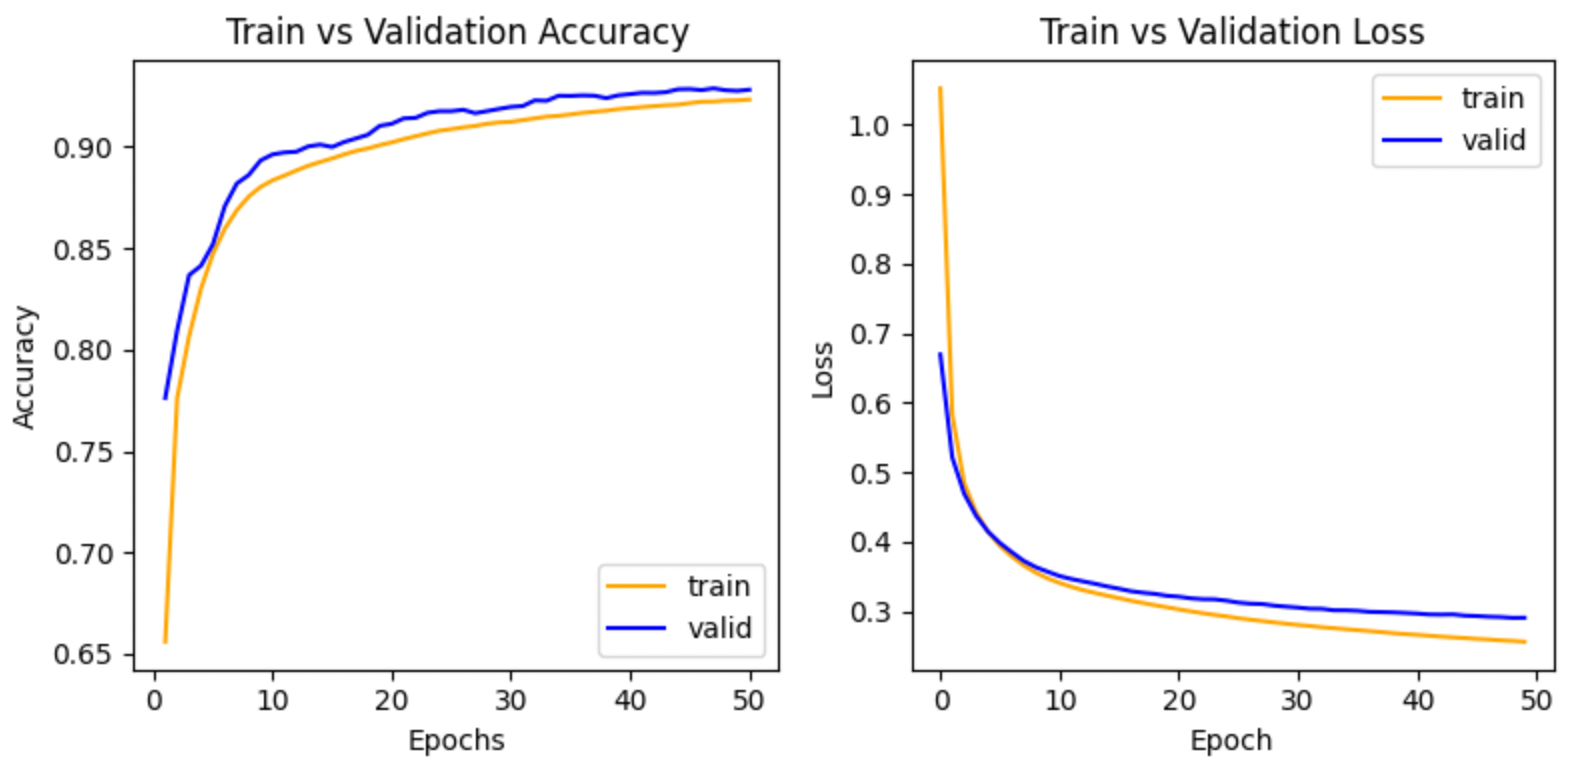
The 1D CNN model quickly surpassed the F1-Scores of the other models. With hyperparameter tuning, the most successful 1D CNN configuration achieved an F1-Score (macro average) of 0.93 with 2 convolutional layers and 4 fully connected layers, using a ReLU activation and dropout (20%) between each layer.

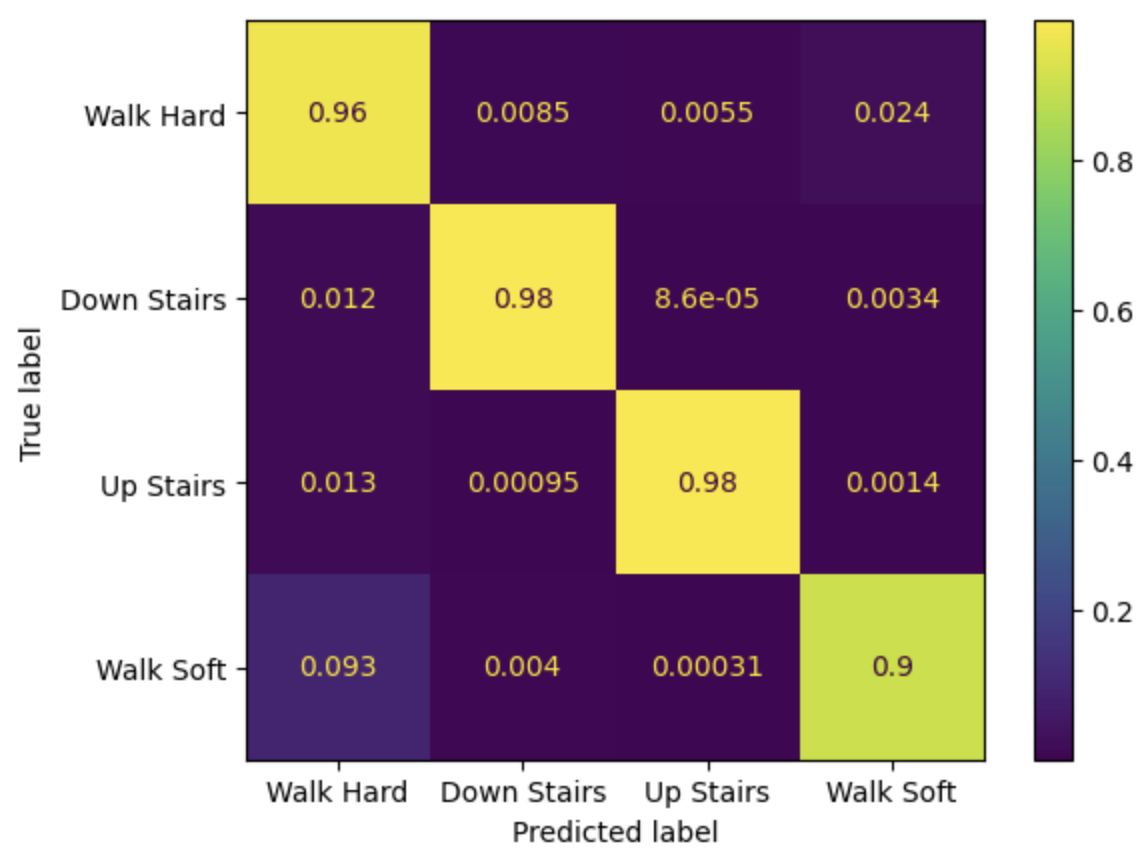
The confusion matrix shows the model's high accuracy in classifying different gait types with high probabilities. For example, "Down Stairs" was correctly predicted 98% of the time, and "Up Stairs" was correctly predicted 98% of the time. The off-diagonal values are very low, indicating a low rate of misclassification.

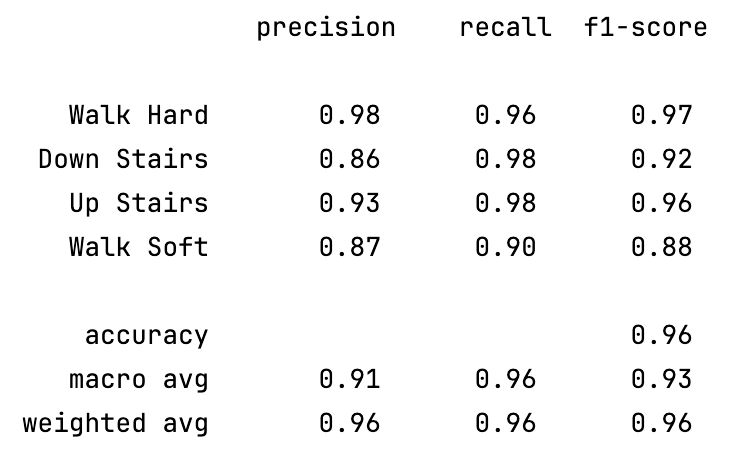
The metrics table confirms the strong performance. The macro average F1-score is 0.93, with high precision and recall values across all gait types. "Walk Hard" and "Up Stairs" show particularly strong performance with F1-scores of 0.97 and 0.96, respectively. The lowest performance is for "Walk Soft," with an F1-score of 0.88, but this is still a strong result.

